Mirasol Confirms Silver Results from the Ely, Margarita, and Naty Veins, Virginia Vein Zone, Argentina
Mirasol Confirms Silver Results from the
Ely, Margarita, and Naty Veins, Virginia Vein Zone, Argentina
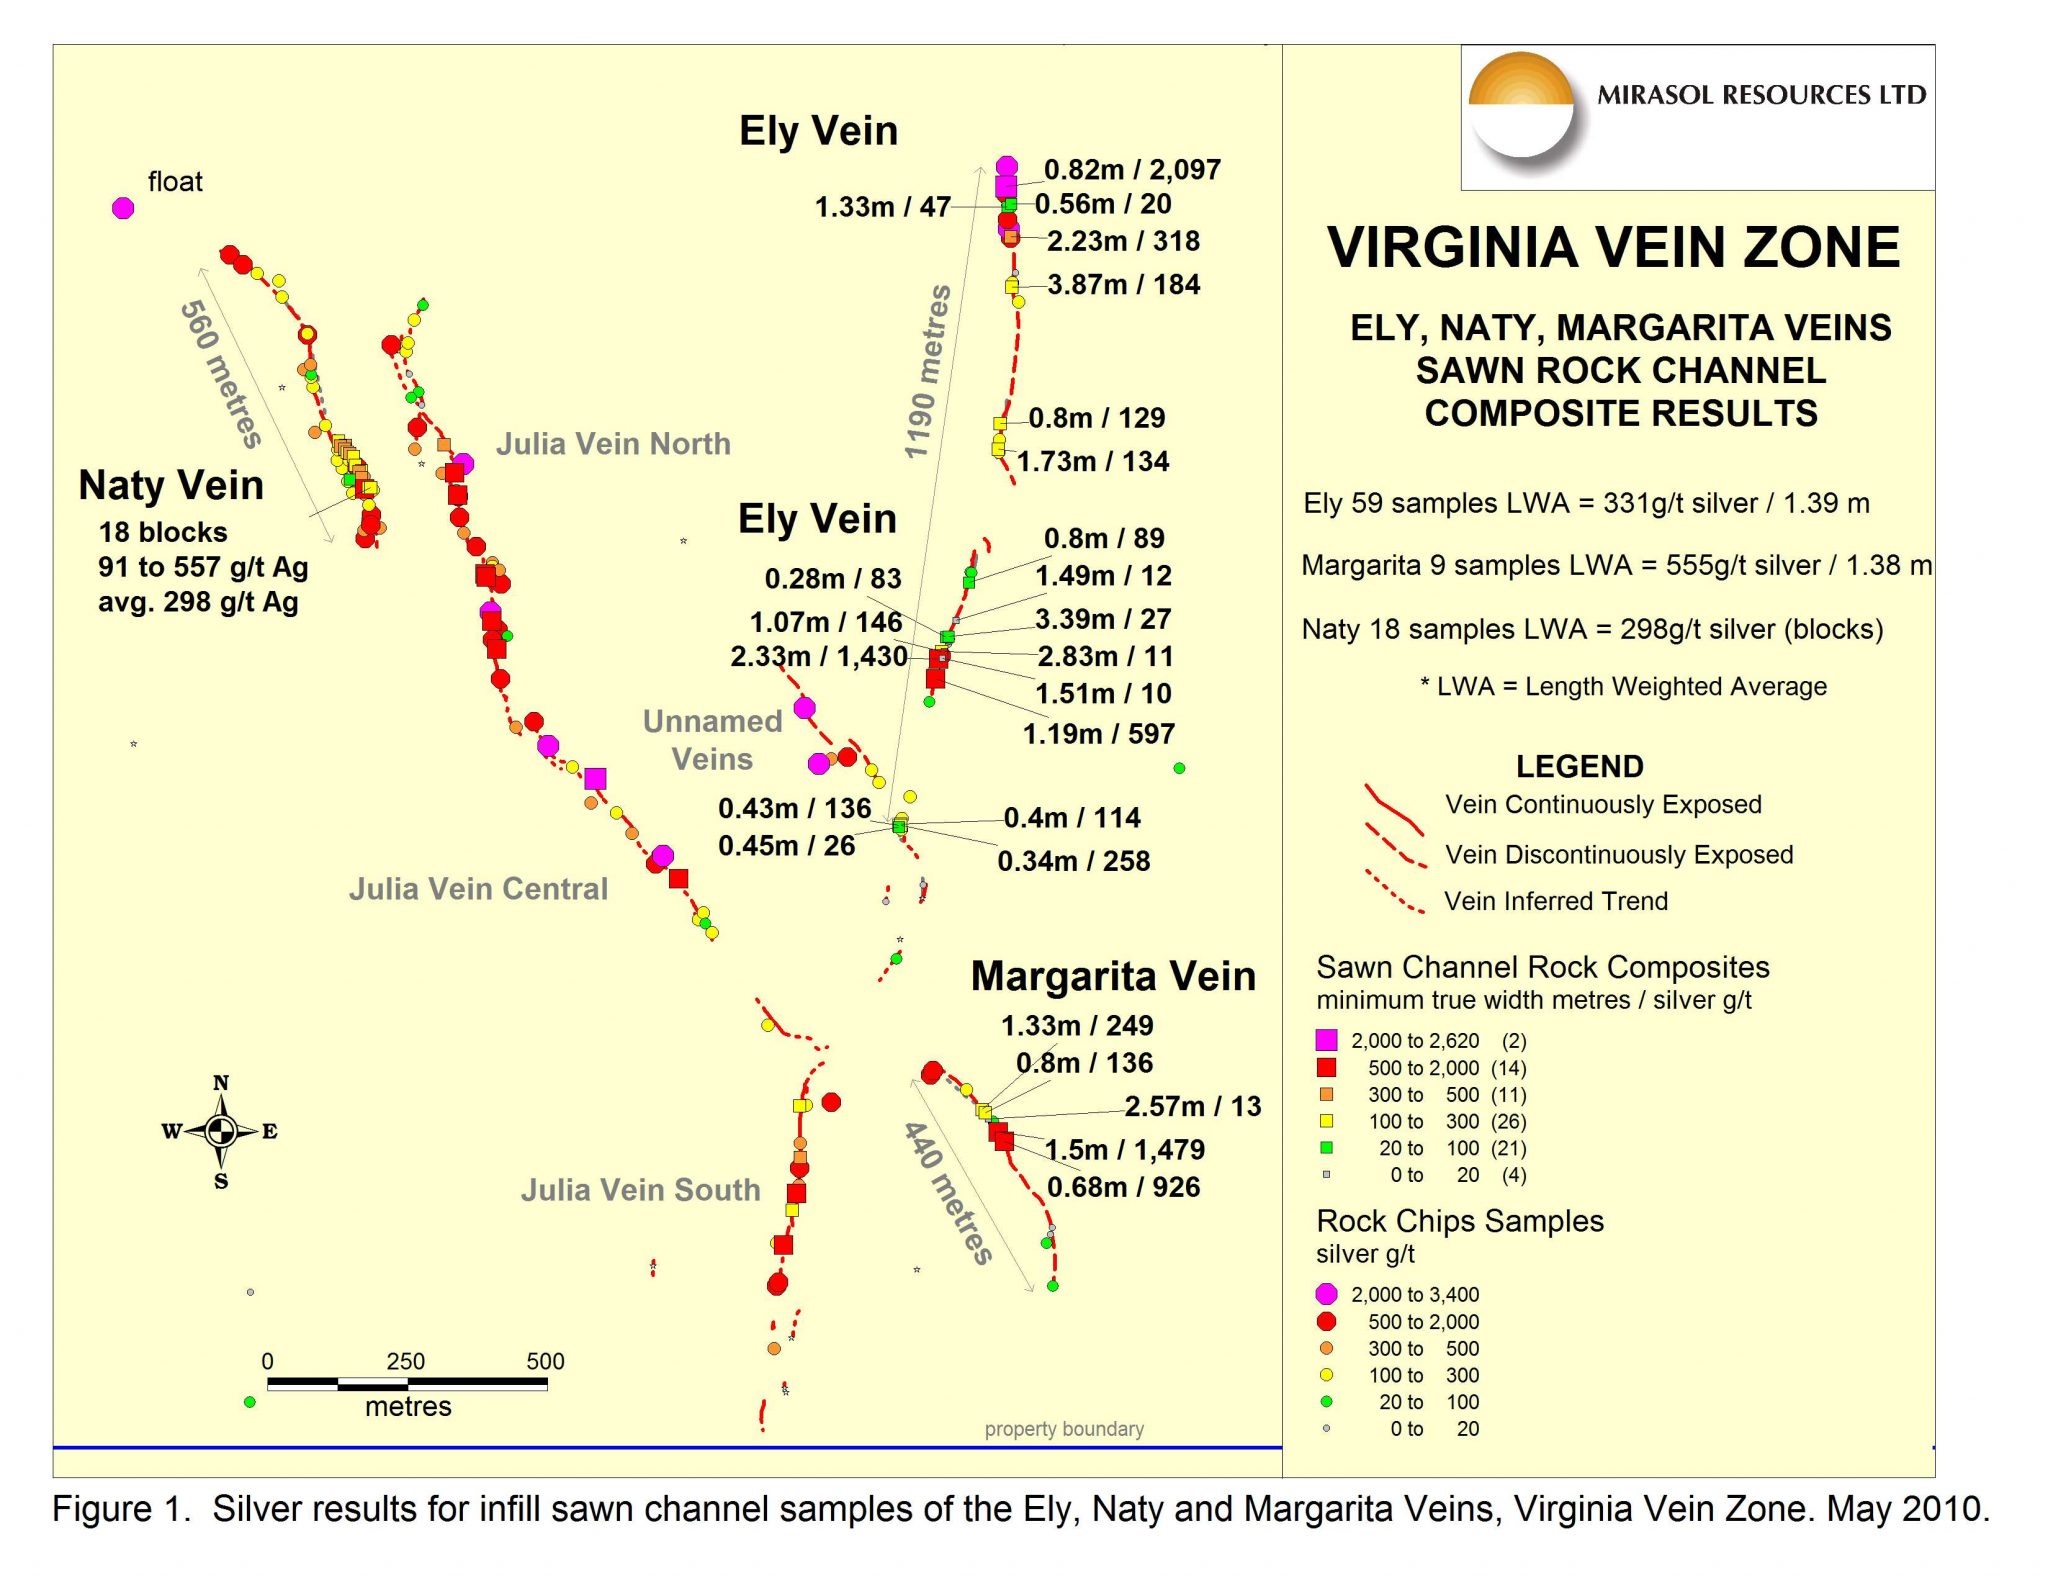
VANCOUVER, BC, June 7, 2010 – Mirasol Resources Ltd. (TSX-V: MRZ, Frankfurt: M8R). New zones of high grade silver mineralization at the Ely, Margarita and Naty veins which flank the silver- rich Julia vein have been identified at the 100% Mirasol owned Virginia Vein Zone, Santa Cruz province, Argentina (see news releases of March 4 and April 13, 2010). Preliminary results from an extensive ground magnetic and gradient array IP geophysical survey at the Virginia Vein Zone have identified soil covered extensions of outcropping high grade silver veins. Current results increase the total length of well-mineralized veins and potential drill targets at the zone.
This press release presents new results from channel sampling of the Ely, Margarita and Naty veins (Figure 1), including saw-cut rock chip sampling comprising 86 channel samples forming 41 composite channel sample lines. The Ely Vein averaged 331 grams per tonne (“g/t”) silver over an average width of 1.39 metres from 20 composite channel lines, with best results of 2.3 metres at 1,430 g/t silver and 0.83 metres at 2,097 g/t silver. At the Margarita and Naty veins, sampling of outcrop and subcrop blocks returned an average 555 g/t and 298 g/t silver, from 5 and 16 composite channel lines, respectively.
Table 1. Summary of New Channel Samples for the Ely, Margarita and Naty Veins
|
Vein |
Channel Composites |
Individual Samples |
Cumulative Length Sampled (m) |
Strike Length of Channels |
|
Ely |
20 |
59 |
22.53 |
1,190 |
|
Margarita |
5 |
9 |
5.62 |
70 |
|
Naty |
16 |
18 |
8.50 |
100 |
|
Totals |
41 |
86 |
36.65 |
1,360 |
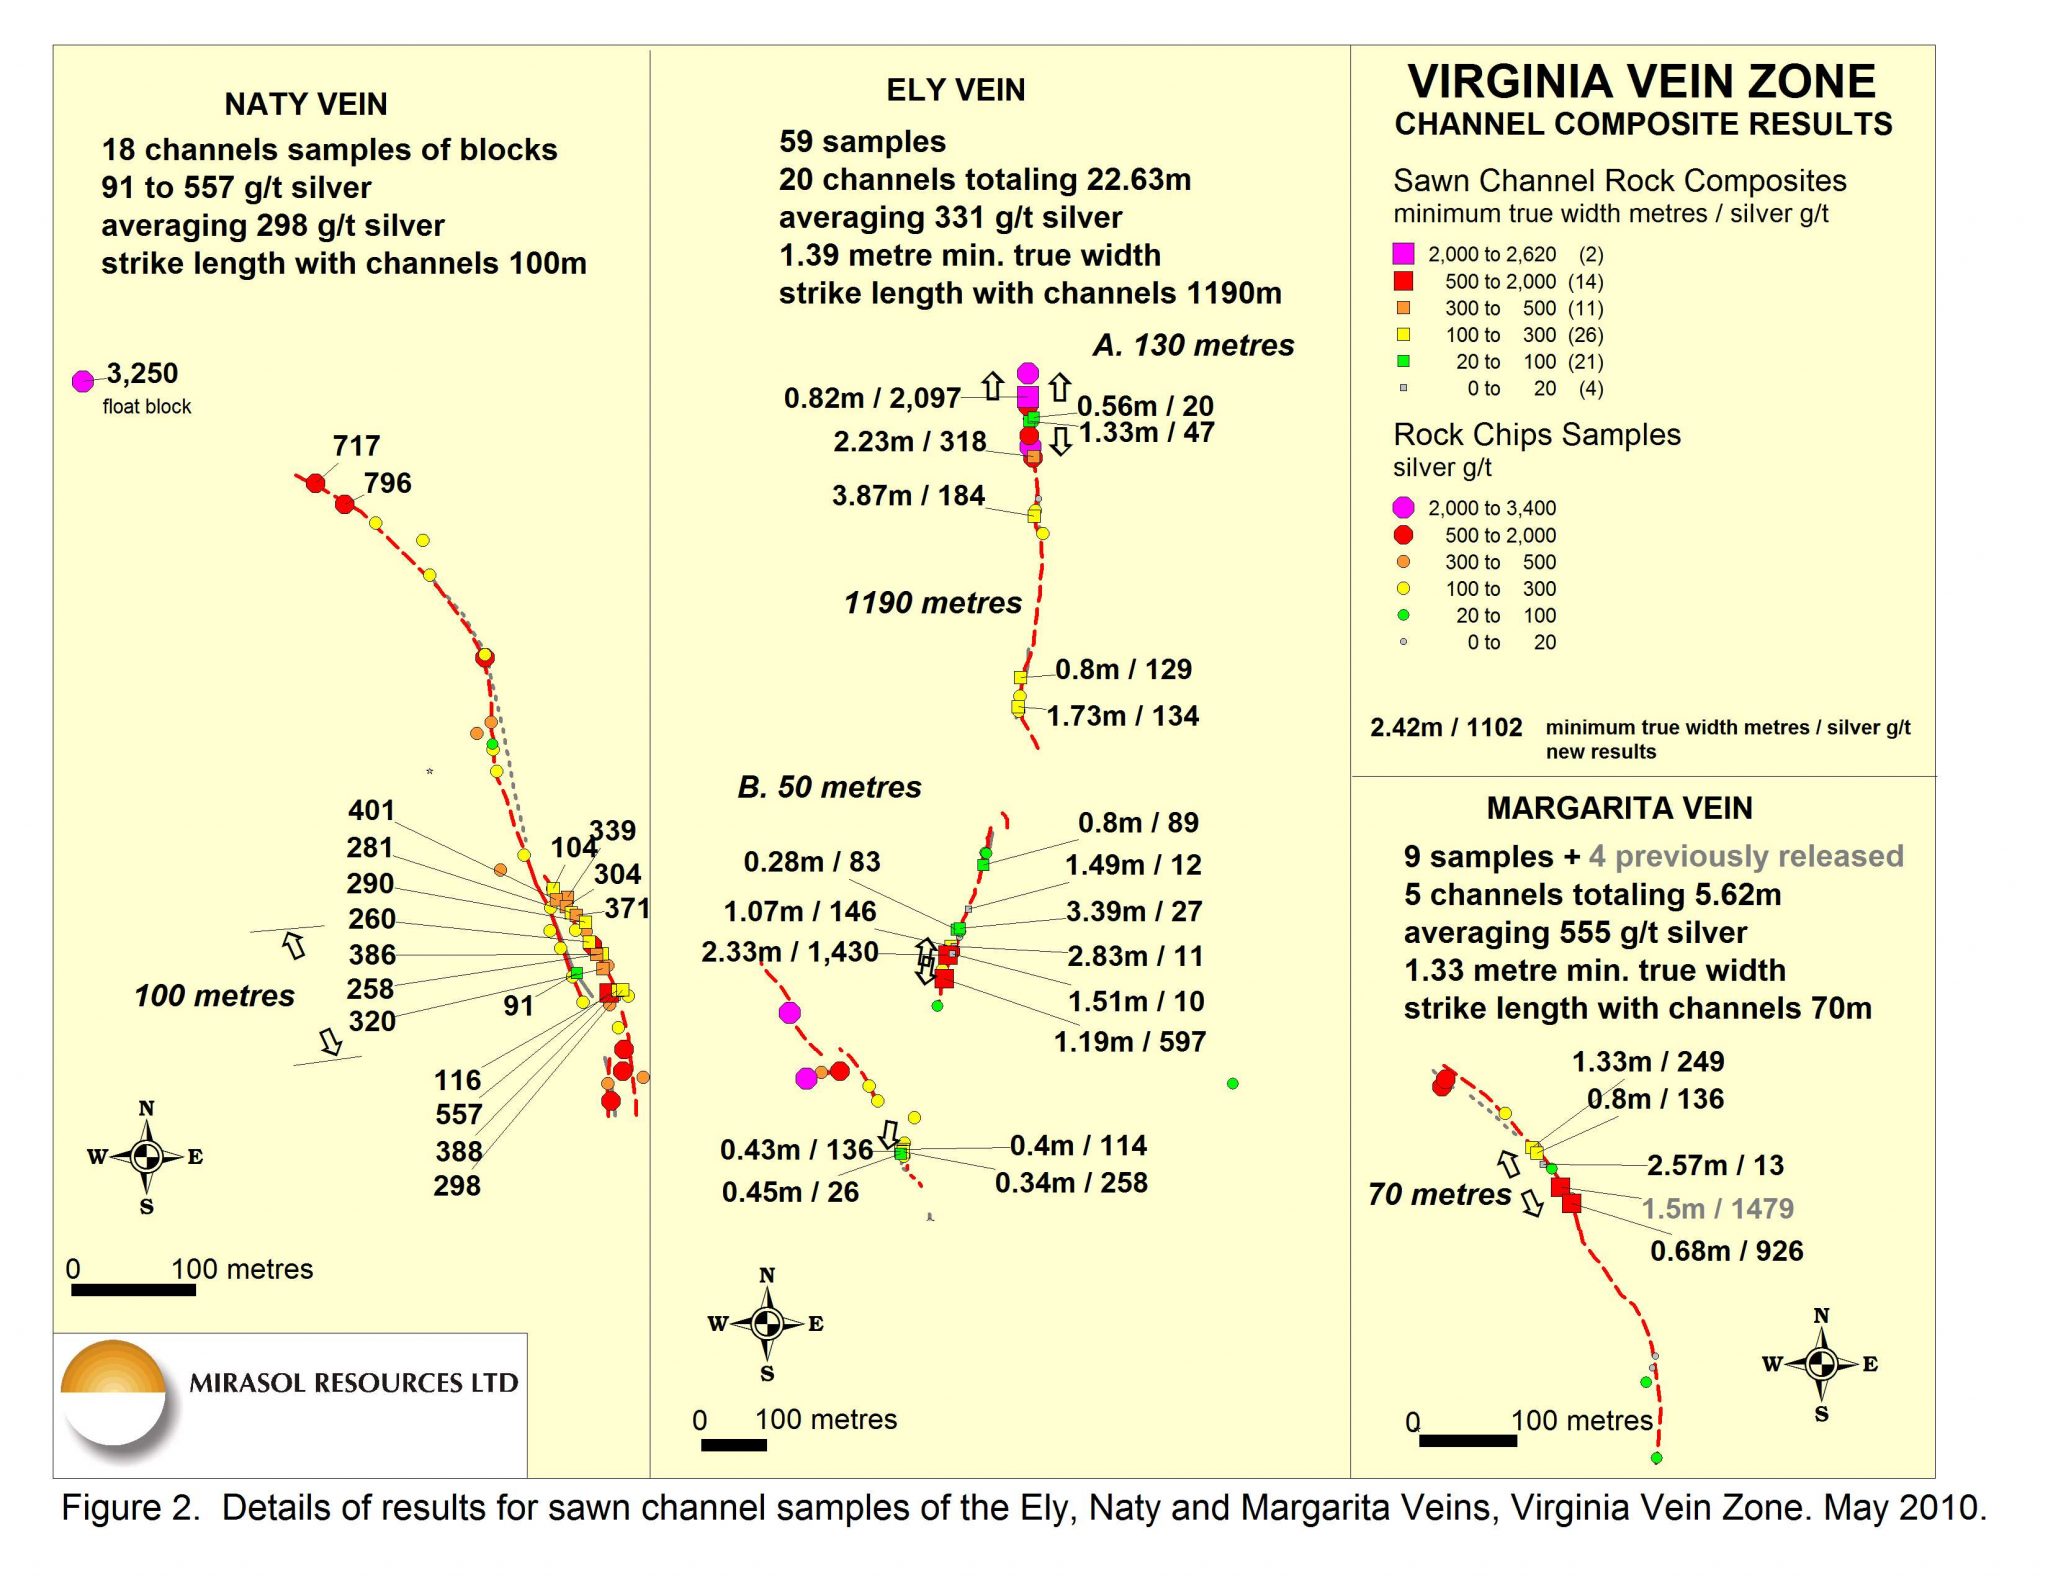
In detail, the Ely vein (Figure 2, central panel) comprises a north-northeast trending vein structure that in some sections becomes two parallel veins. Channel samples were collected at 20 locations along strike where outcrop permitted. The length weighted average (“LWA”) grade for all channel composites is 1.39 metres at 331 g/t silver (Table 2), taken over a strike length of 1,190 metres of the vein’s 2000 metre exposed trend. The wall rock to the vein is generally not visible, such that stated widths reflect minimum true widths.
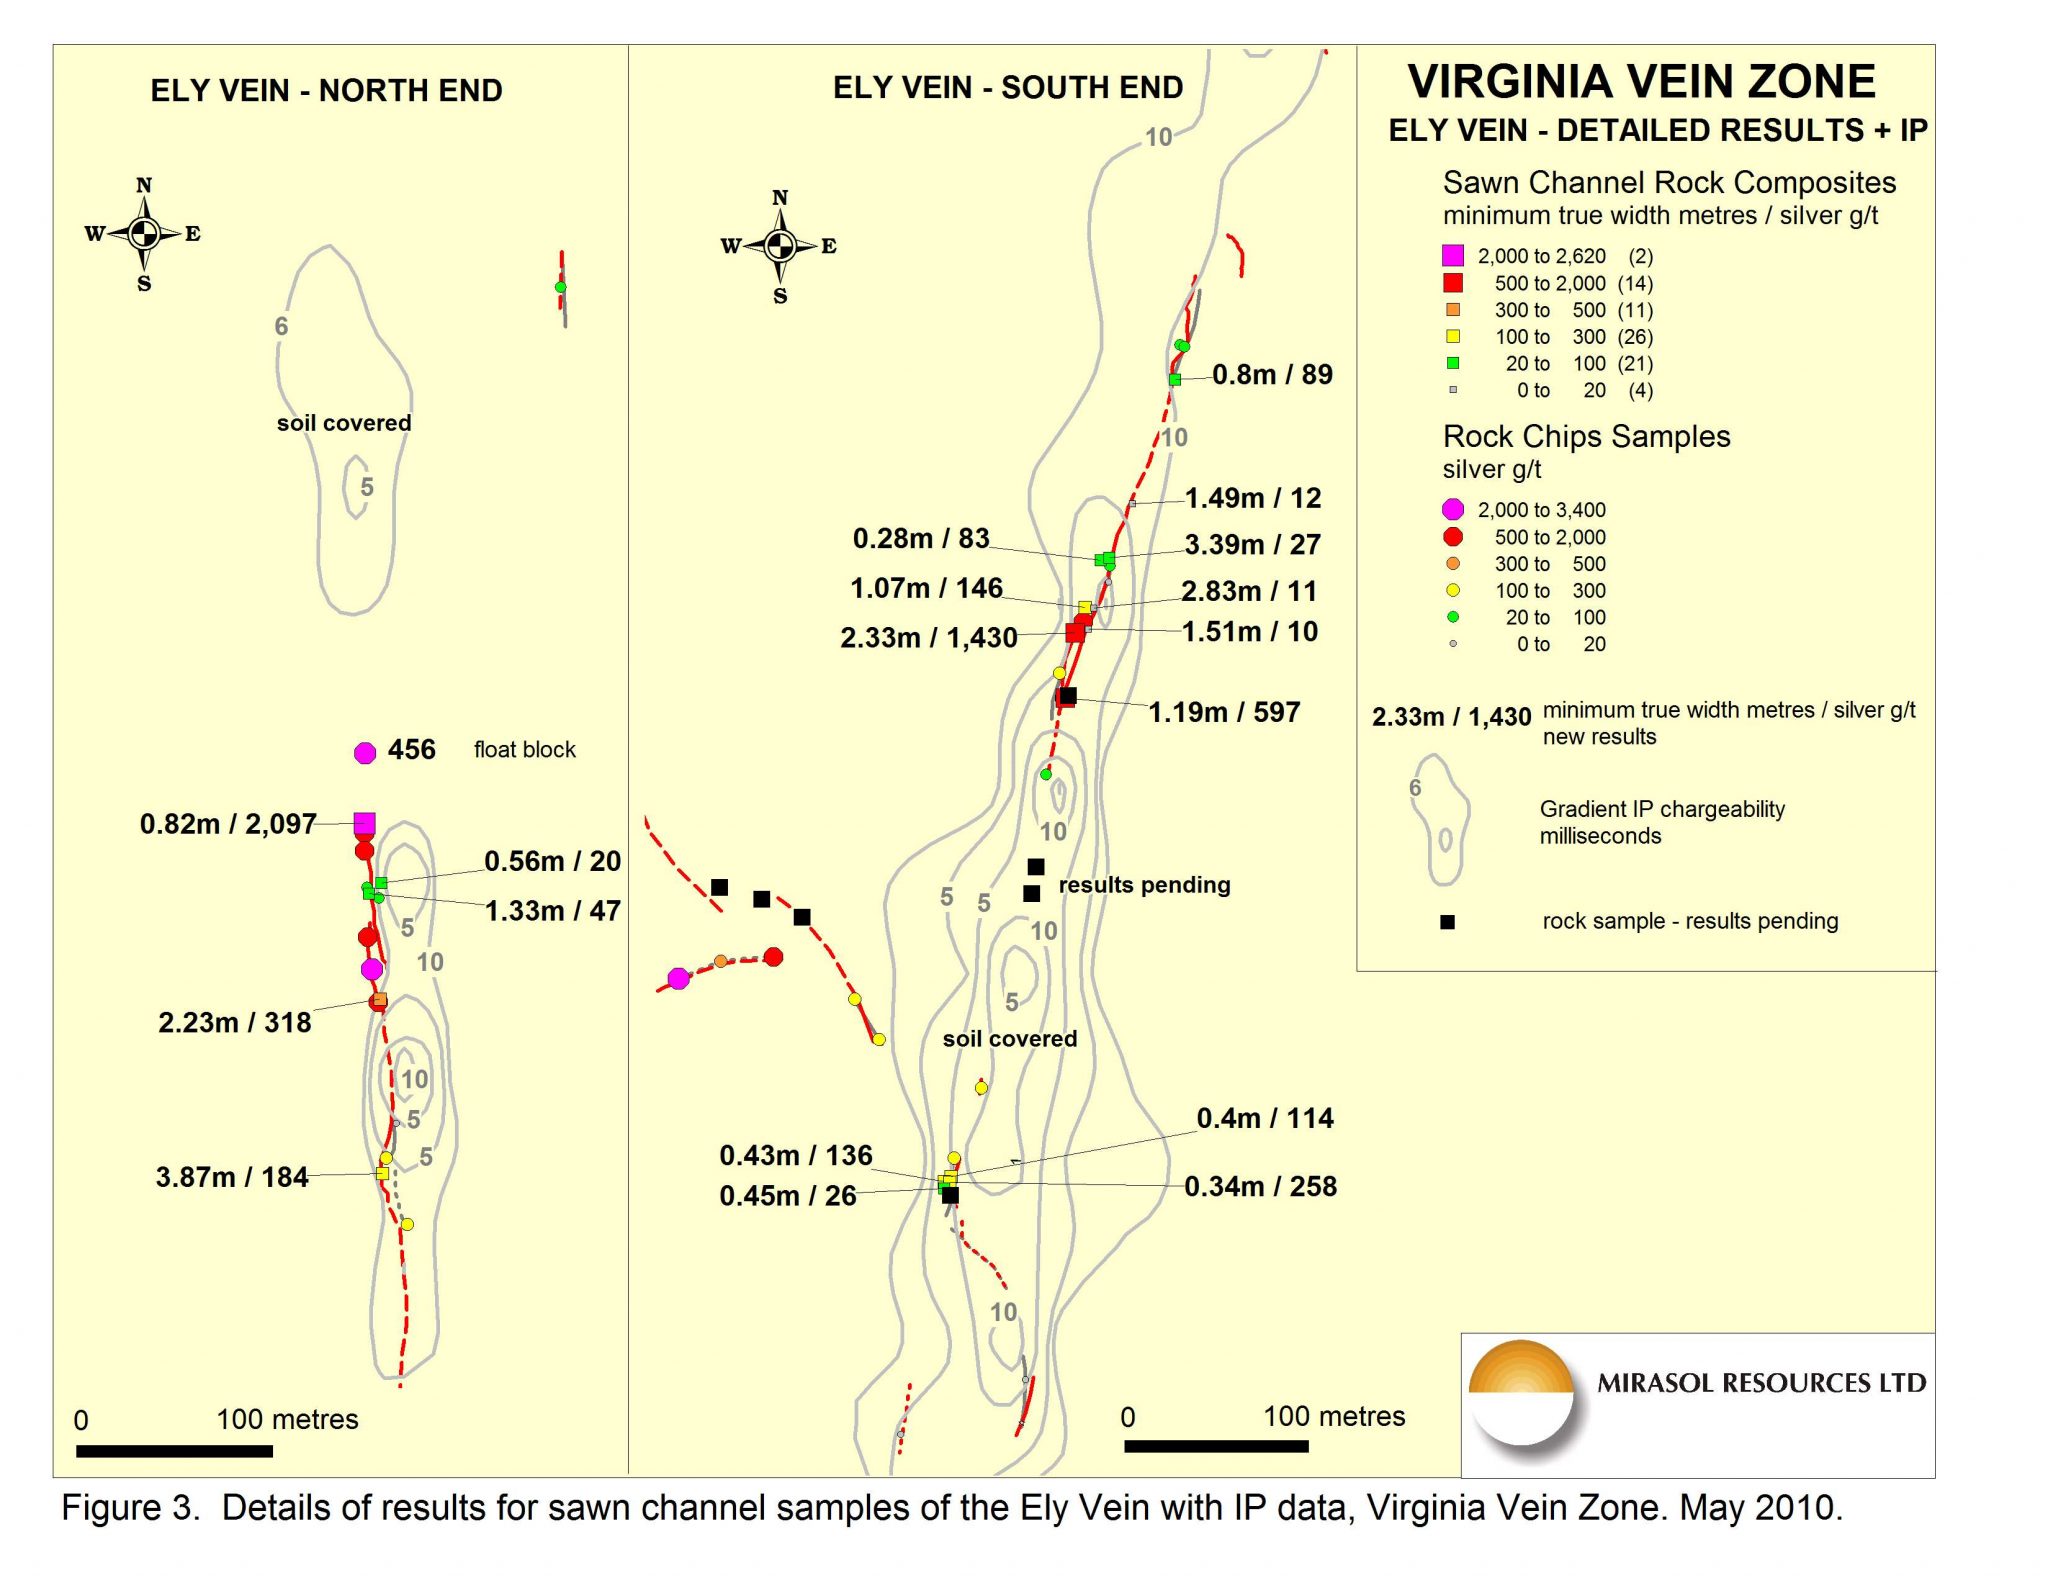
Silver grades at Ely are variable, but sampling indicates that highest grades occur in two distinct segments of the vein. The northern segment crops out discontinuously over a strike length of 130 metres where channel composites grade up to 2,097 g/t silver over 0.83 metres width. Supporting high grades are found in rock chip samples to the south of this channel, and in a float block north of it that contains 2,350 g/t silver (Figure 3, left panel).
Mirasol recently completed in-house Gradient Array IP (induced polarization) geophysical surveys which produced a strong chargeability anomaly of up to 10 milliseconds, coincident with the vein. North of the channel sampling and float block, the vein structure passes under soil, however IP indicates a similar anomaly located less than 100 metres north of the float block. Systematic mechanical trenching or drilling is required to test this target.
Table 2. Ely Vein Channel Composites — Compiled Results
|
Channel ID |
Sampled |
Unsampled |
Gaps as % |
Total |
Silver |
Lead |
|
EL-40328 |
0.81 |
0.02 |
2% |
0.83 |
2,097 |
0.27 |
|
EL-40292a |
1.33 |
0.00 |
|
1.33 |
47 |
0.17 |
|
EL-40292b7 |
0.56 |
0.00 |
27% |
0.56 |
20 |
0.08 |
|
EL-40237 |
2.22 |
0.00 |
|
2.22 |
318 |
0.25 |
|
EL-401467 |
1.70 |
2.17 |
56% |
3.87 |
184 |
0.10 |
|
EL-39904 |
0.80 |
0.00 |
|
0.80 |
129 |
0.46 |
|
EL-39860 |
1.57 |
0.16 |
9% |
1.73 |
133 |
0.47 |
|
EL-39620 |
0.74 |
0.05 |
6% |
0.79 |
89 |
0.04 |
|
EL-395537 |
1.14 |
0.34 |
23% |
1.48 |
12 |
0.37 |
|
EL-39523a |
0.28 |
0.00 |
|
0.28 |
83 |
0.03 |
|
EL-39523b7 |
2.50 |
0.91 |
27% |
3.41 |
27 |
0.27 |
|
EL-39496a7 |
0.58 |
0.49 |
46% |
1.07 |
146 |
0.07 |
|
EL-39496b7 |
2.25 |
0.57 |
20% |
2.82 |
11 |
0.40 |
|
EL-39482ª |
2.21 |
0.10 |
4% |
2.31 |
1,430 |
1.21 |
|
EL-39482b7 |
1.10 |
0.41 |
27% |
1.51 |
10 |
0.49 |
|
EL-39449 |
1.20 |
0.00 |
|
1.20 |
596 |
0.36 |
|
EL-39190 |
0.40 |
0.00 |
|
0.40 |
114 |
0.37 |
|
EL-39184a |
0.35 |
0.08 |
19% |
0.43 |
136 |
0.08 |
|
EL-39184b |
0.34 |
0.00 |
|
0.34 |
258 |
1.32 |
|
EL-39184c |
0.45 |
0.00 |
|
0.45 |
26 |
0.24 |
|
Length Weighted Average |
1.39 |
331 |
0.39 |
|||
Notes: All analyses done by ALS Chemex Laboratory.
1. Sampled length is the actual true width that was sampled.
2. Unsampled gaps are the cumulative length of any gaps in outcrop which were unable to be sampled. See Technical Appendix of March 4, 2010 press release for details.
3. Total length is the sum of the actual sampled outcrop plus any gaps which could not be sampled.
4. The length weighted silver, gold and lead averages are based on the sampled width not the total length and all values are uncut (i.e. no grade capping has been applied).
5. Silver results are by Ag-GRA21, a fire-assay collection method with gravimetric finish.
6. Lead results to 10,000 ppm (1%) are by ME-ICP41 with over values >1% by Pb-OG46.
7. Channels so marked have sampling gaps greater than 20% of their total length. See Technical Appendix of March 4, 2010 press release.
8. Gold assayed by Au-AA24, a fire-assay collection method with atomic absorption spectroscopy finish. Gold values for the channel composites range from
In the southern part of the Ely Vein, a 50 metre long segment returned channel samples reaching 1,430 g/t silver over 2.31 metres minimum true width (Figure 3 right panel). Two parallel vein branches show increased silver values towards the south end of the exposed structure. Gradient IP results indicate the vein corresponds to a chargeability anomaly of up to 12 milliseconds, which increases in strength to the south into an area that is largely soil-covered. Prospecting of the extension of the vein structure over the IP anomaly encountered mineralized float blocks of vein material and assays are pending. The strongest chargeability anomaly corresponds to 250 metres of mostly covered strike length located between the channel samples discussed above, and sparse float blocks (between channels EL-39449 with 1.2 metres of 596 g/t Ag, and EL-39190), and is considered highly prospective.
The Margarita Vein (Figure 2, right panel) averaged 555 g/t silver over 1.38 metres based on 5 composite channel lines (channel composite MA-38639 was previously released). Grades at Margarita are quite variable reflecting several texturally distinct vein phases including crustiform banded and breccia vein types, both containing moderate to high silver grades, and a tectonic breccia containing lower grades (channel composite MA-38663\ Ag). In many respects, the Margarita Vein visually resembles the Julia Vein (news releases of March 4 and Apr. 13, 2010) over its 200 metre exposure.
Table 3. Margarita Vein Channel Samples — Compiled Results
|
Channel ID |
Sampled Length |
Unsampled Gaps |
Gaps as % |
Total Length |
Silver (g/t)4, 5 |
Lead |
|
MA-386807 |
0.82 |
0.52 |
39% |
1.34 |
249 |
0.41 |
|
MA-38674 |
0.79 |
0.00 |
|
0.79 |
136 |
0.39 |
|
MA-386637 |
1.90 |
0.67 |
26% |
2.57 |
13 |
0.04 |
|
MA-38639* |
1.50 |
0.00 |
|
1.50 |
1,479 |
0.62 |
|
MA-38623 |
0.61 |
0.08 |
12% |
0.69 |
926 |
0.13 |
|
Length Weighted Average |
1.38 |
555 |
1.27 |
|||
|
Notes as per Table 2. |
||||||
The Naty Vein (Figure 2 left panel) is poorly exposed and channel sampling of outcrop was not possible. Instead, individual blocks of locally-derived, subcrop were channel sampled to determine the typical grades of the vein, but no assumptions were made concerning the vein’s width. The blocks sampled represent a 100 metre sector of the vein’s known 560 metre strike length as defined by mapping and rock chip sampling. Channel sampled blocks returned grades from 91 to 557 g/t silver and averaged 298 g/t silver. Float and subcrop exposed both north and south of the channel sampled vein sector indicate potential for high silver grades in covered extensions of the Naty Vein. A large, isolated, transported block of vein material assaying 3,250 g/t silver was located 210 metres northwest of the last exposures of the Naty Vein, where subcrop and blocks returned chip samples grading 717 and 796 g/t silver.
Table 4. Naty Vein Channel Samples — Subcrop and Blocks
|
Channel ID |
Sampled Length (m)1 |
Silver (g/t)4, 5 |
Lead |
|
NA-39874 |
0.31 |
104 |
0.23 |
|
NA-39866 (2 samples) |
0.34 |
339 |
0.35 |
|
NA-39865 |
0.50 |
401 |
0.41 |
|
NA-39859 |
0.36 |
304 |
0.50 |
|
NA-39854 |
0.42 |
281 |
0.34 |
|
NA-39851 |
0.53 |
371 |
0.19 |
|
NA-39846 |
0.18 |
290 |
1.58 |
|
NA-39830 |
0.77 |
260 |
1.52 |
|
NA-39821 |
0.85 |
258 |
0.75 |
|
NA-39820 |
0.86 |
386 |
1.06 |
|
NA-39808 |
0.50 |
320 |
1.60 |
|
NA-39805 |
0.50 |
91 |
0.39 |
|
NA-39788a (2 samples) |
0.37 |
557 |
0.74 |
|
NA-39788b |
0.64 |
388 |
0.55 |
|
NA-39788c |
0.59 |
116 |
0.58 |
|
NA-39788d |
0.78 |
298 |
0.82 |
|
Length Weighted Average |
298 |
0.75 |
|
Notes are per Table 2.
Ongoing mapping and sampling at the Virginia Vein Zone continues to reveal new veining in outcrop and subcrop, with assays pending from 120 samples from additional newly discovered veins. Extensive high density ground magnetic and gradient array geophysical surveys are in progress. Preliminary results of the gradient array survey show a significant degree of correlation between outcropping veins and chargeable anomalies, and clearly indicate extensions of high grade silver structures under shallow soil cover.
“Exploration at the Virginia Vein Zone has confirmed high grade nature and extensions of silver-rich structures surrounding the Julia Vein, and we believe the results significantly expand the exploration potential. The application of systematic sampling combined with high quality geophysical data has increased the number of prospective drill targets at the Virginia Vein Zone. The property continues to present new opportunities and we look forward to receiving additional exploration results,” stated Mary Little, Mirasol’s President and CEO.
Paul G. Lhotka, Principal Geologist for Mirasol, is the Qualified Person under NI 43-101 who has approved the technical content of this news release.
For further information, contact:
Mary L. Little
President and CEO
Tel:(604) 602-9989: Fax:(604) 609-9946
Email: contact@mirasolresources.com
Website: www.mirasolresources.com
Quality Assurance/Quality Control:
Exploration at Mirasol’s Projects is supervised by Stephen C. Nano, Vice President of Exploration; Exploration Manager, Timothy Heenan; and Principal Geologist, Paul Lhotka, all qualified persons under NI 43-101. All technical information for the Company’s projects is obtained and reported under a formal quality assurance and quality control (QA/QC) program. Rock chip and stream sediment samples are collected under the supervision of Company geologists in accordance with standard industry practice. Samples are dispatched via commercial transport to an ISO 9001:2000-accredited laboratory in Mendoza, Argentina for analysis. Results are routinely examined by an independent geochemist to ensure laboratory performance meets required standards.
All assay results reported herein are for surface rock chip samples; assay results from subsurface drill core or RC samples may be higher, lower or similar to results obtained from surface samples.
Neither the TSX Venture Exchange nor its Regulation Services Provider (as that term is defined in the policies of the TSX Venture Exchange) accepts responsibility for the adequacy or accuracy of this release.